Model selection for logistic regression
Duke University
STA 101 Fall 2024
When last we left our heros…
We have been studying regression:
What combinations of data types have we seen?
What did the picture look like?
Recap: simple linear regression
Numerical response and one numerical predictor:
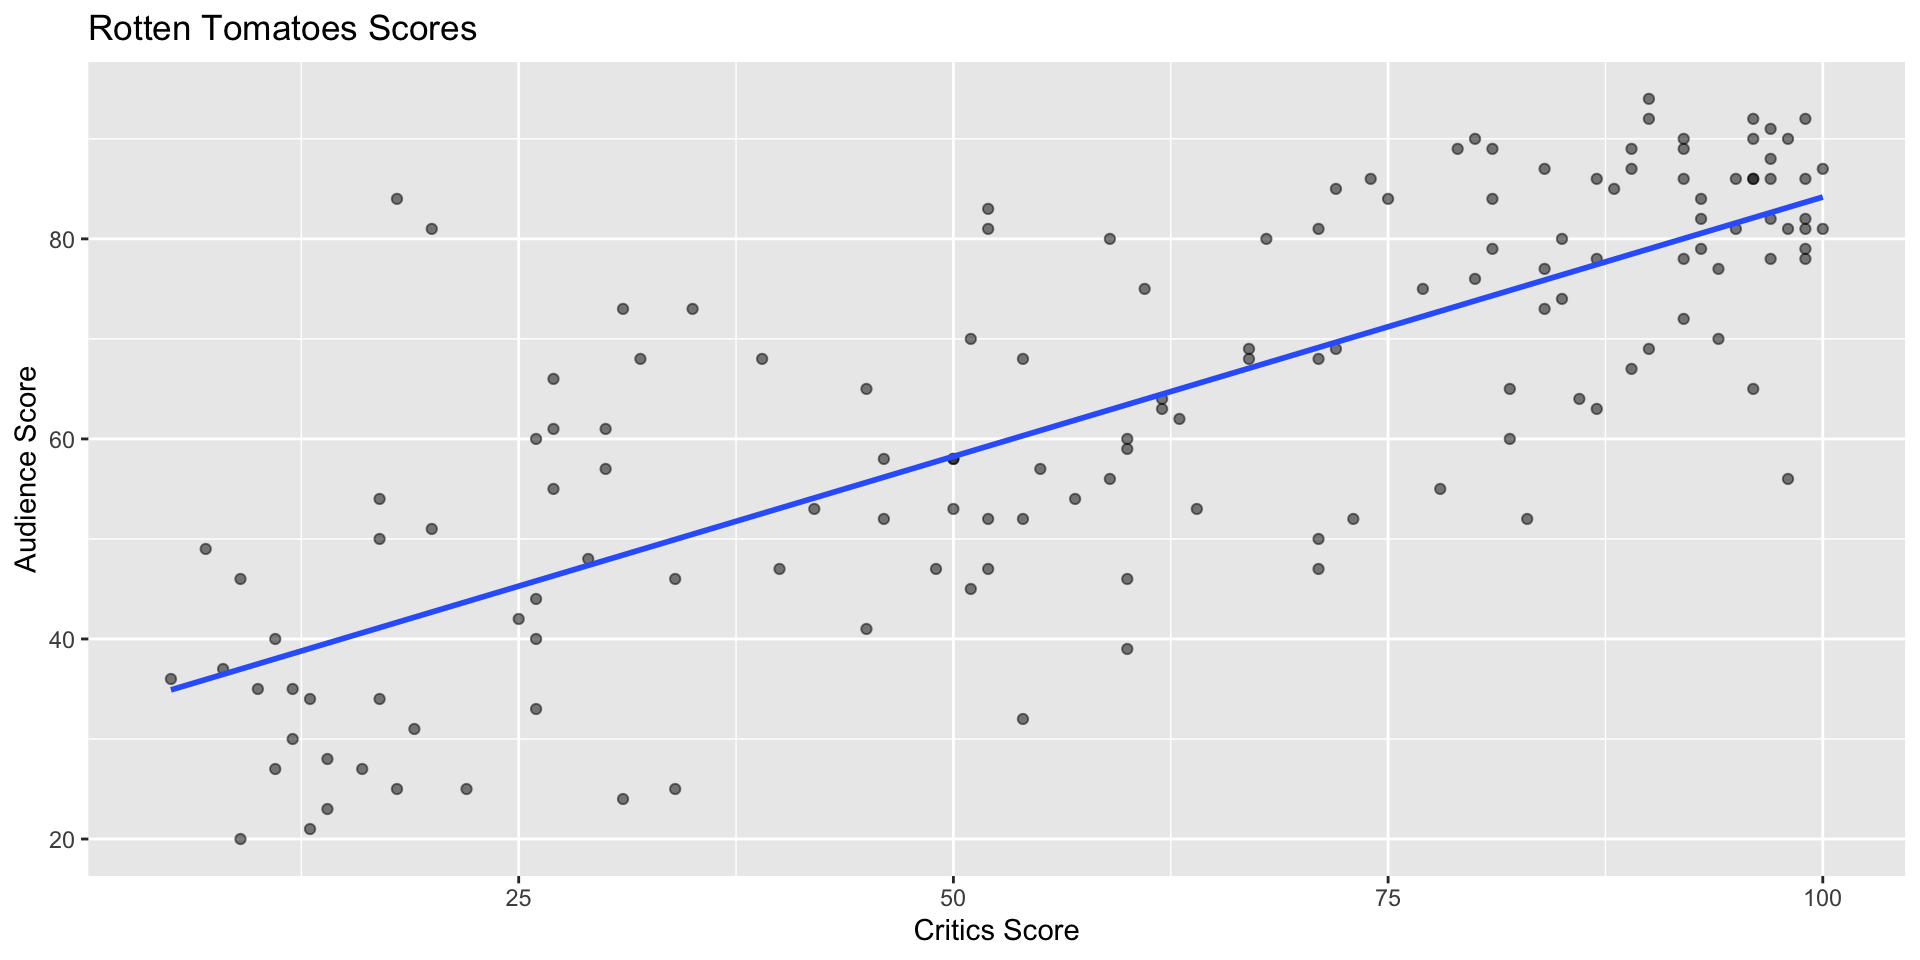
Recap: simple linear regression
Numerical response and one categorical predictor (two levels):

Recap: multiple linear regression
Numerical response; numerical and categorical predictors:

Today: a binary response
\[ y = \begin{cases} 1 & &&\text{eg. Yes, Win, True, Heads, Success}\\ 0 & &&\text{eg. No, Lose, False, Tails, Failure}. \end{cases} \]

Who cares?
If we can model the relationship between predictors (\(x\)) and a binary response (\(y\)), we can use the model to do a special kind of prediction called classification.
Example: is the e-mail spam or not?
\[ \mathbf{x}: \text{word and character counts in an e-mail.} \]

\[ y = \begin{cases} 1 & \text{it's spam}\\ 0 & \text{it's legit} \end{cases} \]
Ethical concerns?
Example: is it cancer or not?
\[ \mathbf{x}: \text{features in a medical image.} \]
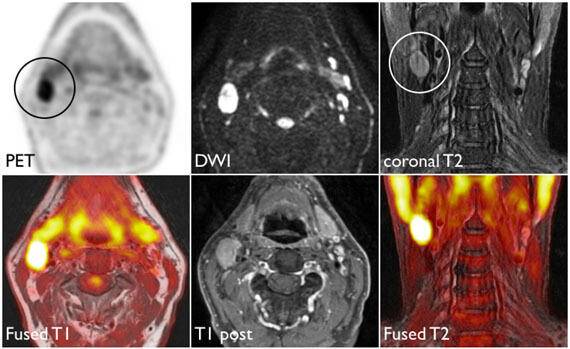
\[ y = \begin{cases} 1 & \text{it's cancer}\\ 0 & \text{it's healthy} \end{cases} \]
Ethical concerns?
Example: will they default?
\[ \mathbf{x}: \text{financial and demographic info about a loan applicant.} \]
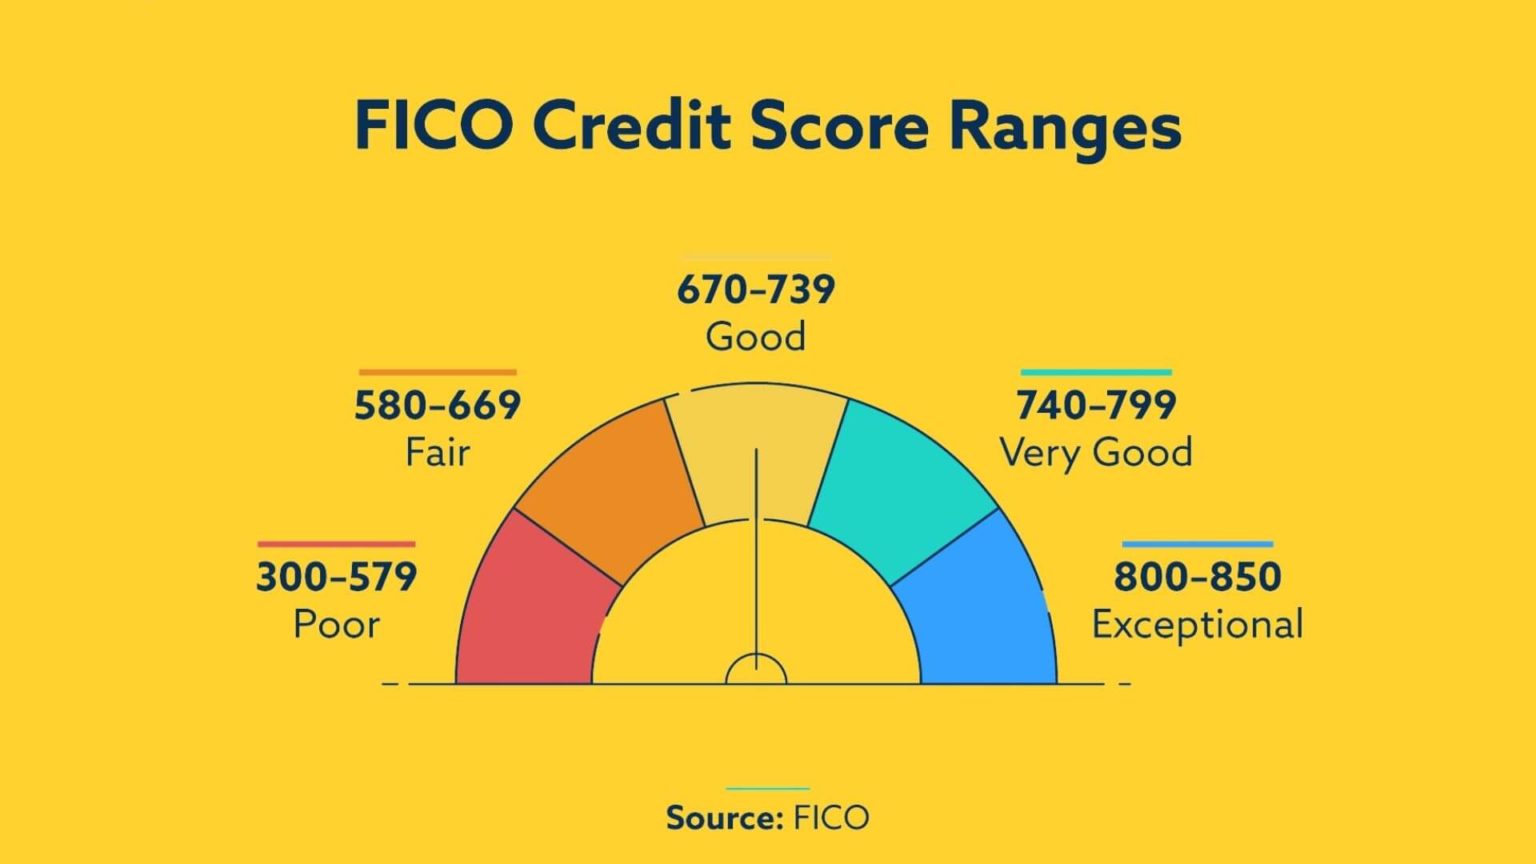
\[ y = \begin{cases} 1 & \text{applicant is at risk of defaulting on loan}\\ 0 & \text{applicant is safe} \end{cases} \]
Ethical concerns?
How do we model this type of data?

Straight line of best fit is a little silly

Instead: S-curve of best fit
Instead of modeling \(y\) directly, we model the probability that \(y=1\):

- “Given new email, what’s the probability that it’s spam?’’
- “Given new image, what’s the probability that it’s cancer?’’
- “Given new loan application, what’s the probability that they default?’’
Why don’t we model y directly?
Recall regression with a numerical response:
- Our models do not output guarantees for \(y\), they output predictions that describe behavior on average;
Similar when modeling a binary response:
- Our models cannot directly guarantee that \(y\) will be zero or one. The correct analog to “on average” for a 0/1 response is “what’s the probability?”
So, what is this S-curve, anyway?
It’s the logistic function:
\[ \text{Prob}(y = 1) = \frac{e^{\beta_0+\beta_1x}}{1+e^{\beta_0+\beta_1x}}. \]
If you set p = Prob(y = 1) and do some algebra, you get the simple linear model for the log-odds:
\[ \log\left(\frac{p}{1-p}\right) = \beta_0+\beta_1x. \]
This is called the logistic regression model.
Log-odds?
p = Prob(y = 1) is a probability. A number between 0 and 1;
p / (1 - p) is the odds. A number between 0 and \(\infty\);
“The odds of this lecture going well are 10 to 1.”
- The log odds log(p / (1 - p)) is a number between \(-\infty\) and \(\infty\), which is suitable for the linear model.
Logistic regression
\[ \log\left(\frac{p}{1-p}\right) = \beta_0+\beta_1x. \]
The logit function log(p / (1-p)) is an example of a link function that transforms the linear model to have an appropriate range;
This is an example of a generalized linear model;
Estimation
We estimate the parameters \(\beta_0,\,\beta_1\) using maximum likelihood (don’t worry about it) to get the “best fitting” S-curve;
The fitted model is
\[ \log\left(\frac{\widehat{p}}{1-\widehat{p}}\right) = b_0+b_1x. \]
Logistic regression -> classification?
Step 1: pick a threshold
Select a number \(0 < p^* < 1\):
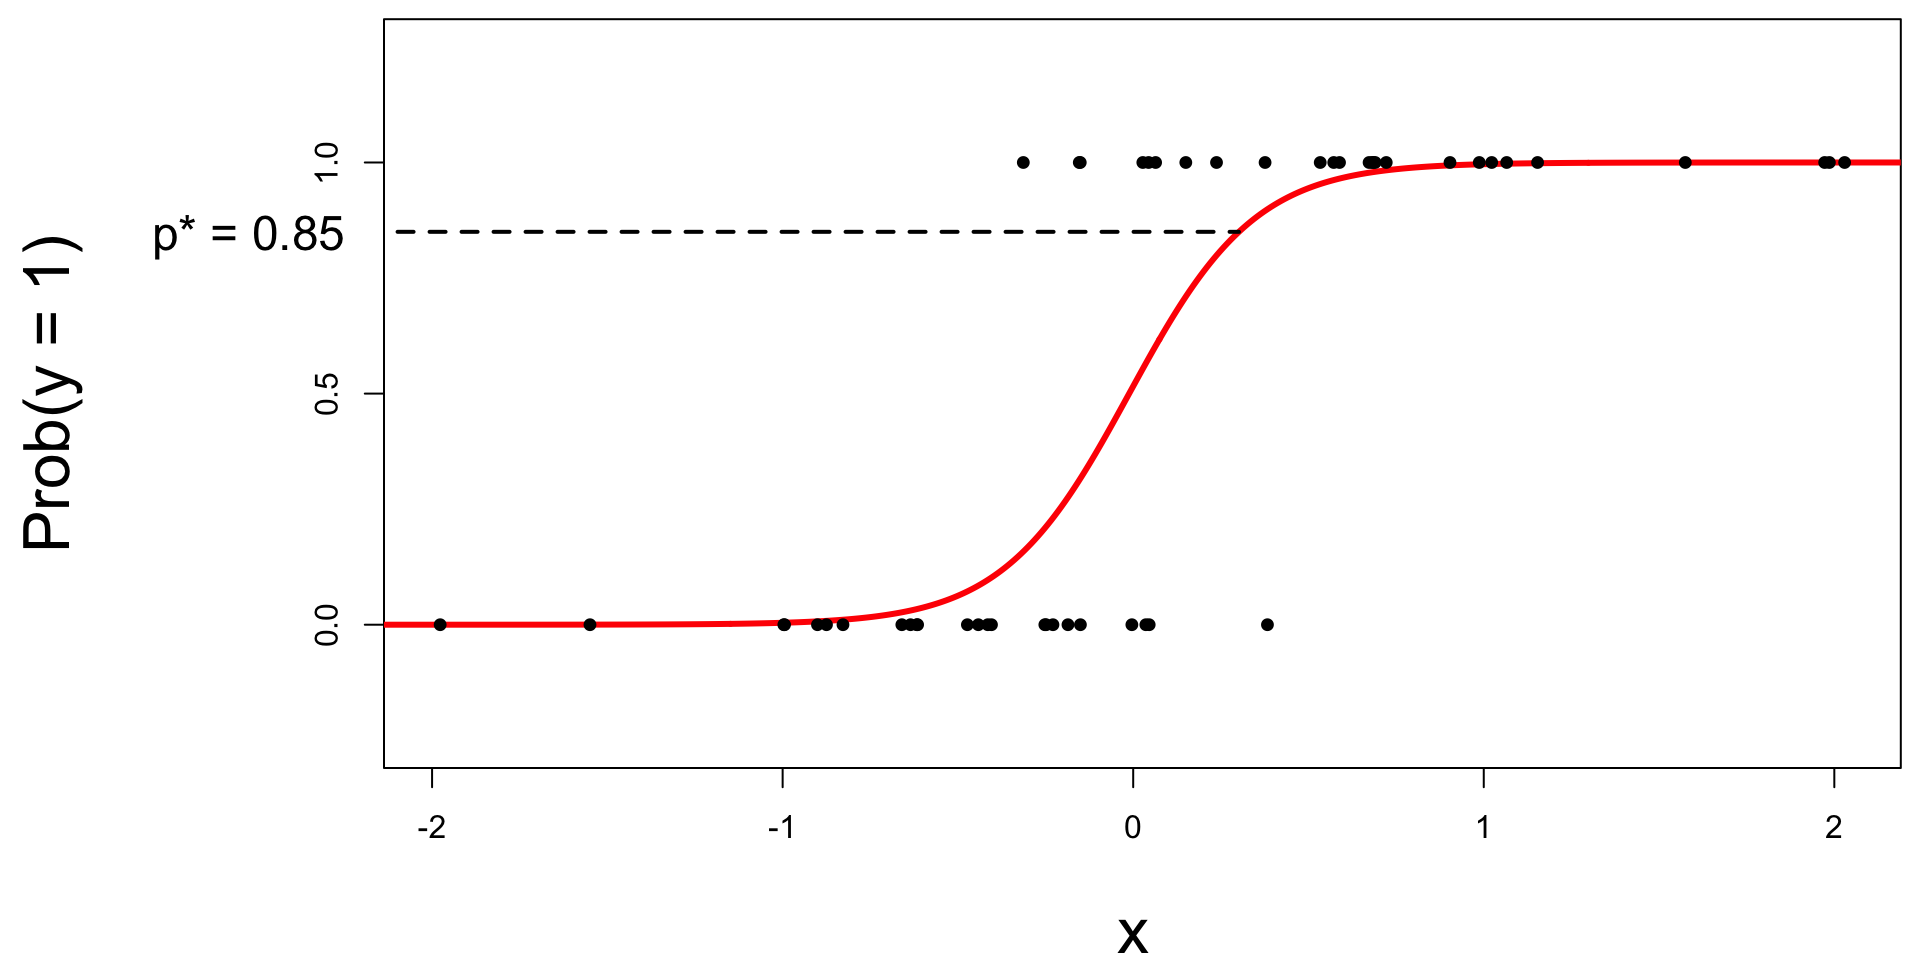
- if \(\text{Prob}(y=1)\leq p^*\), then predict \(\widehat{y}=0\);
- if \(\text{Prob}(y=1)> p^*\), then predict \(\widehat{y}=1\).
Step 2: find the “decision boundary”
Solve for the x-value that matches the threshold:
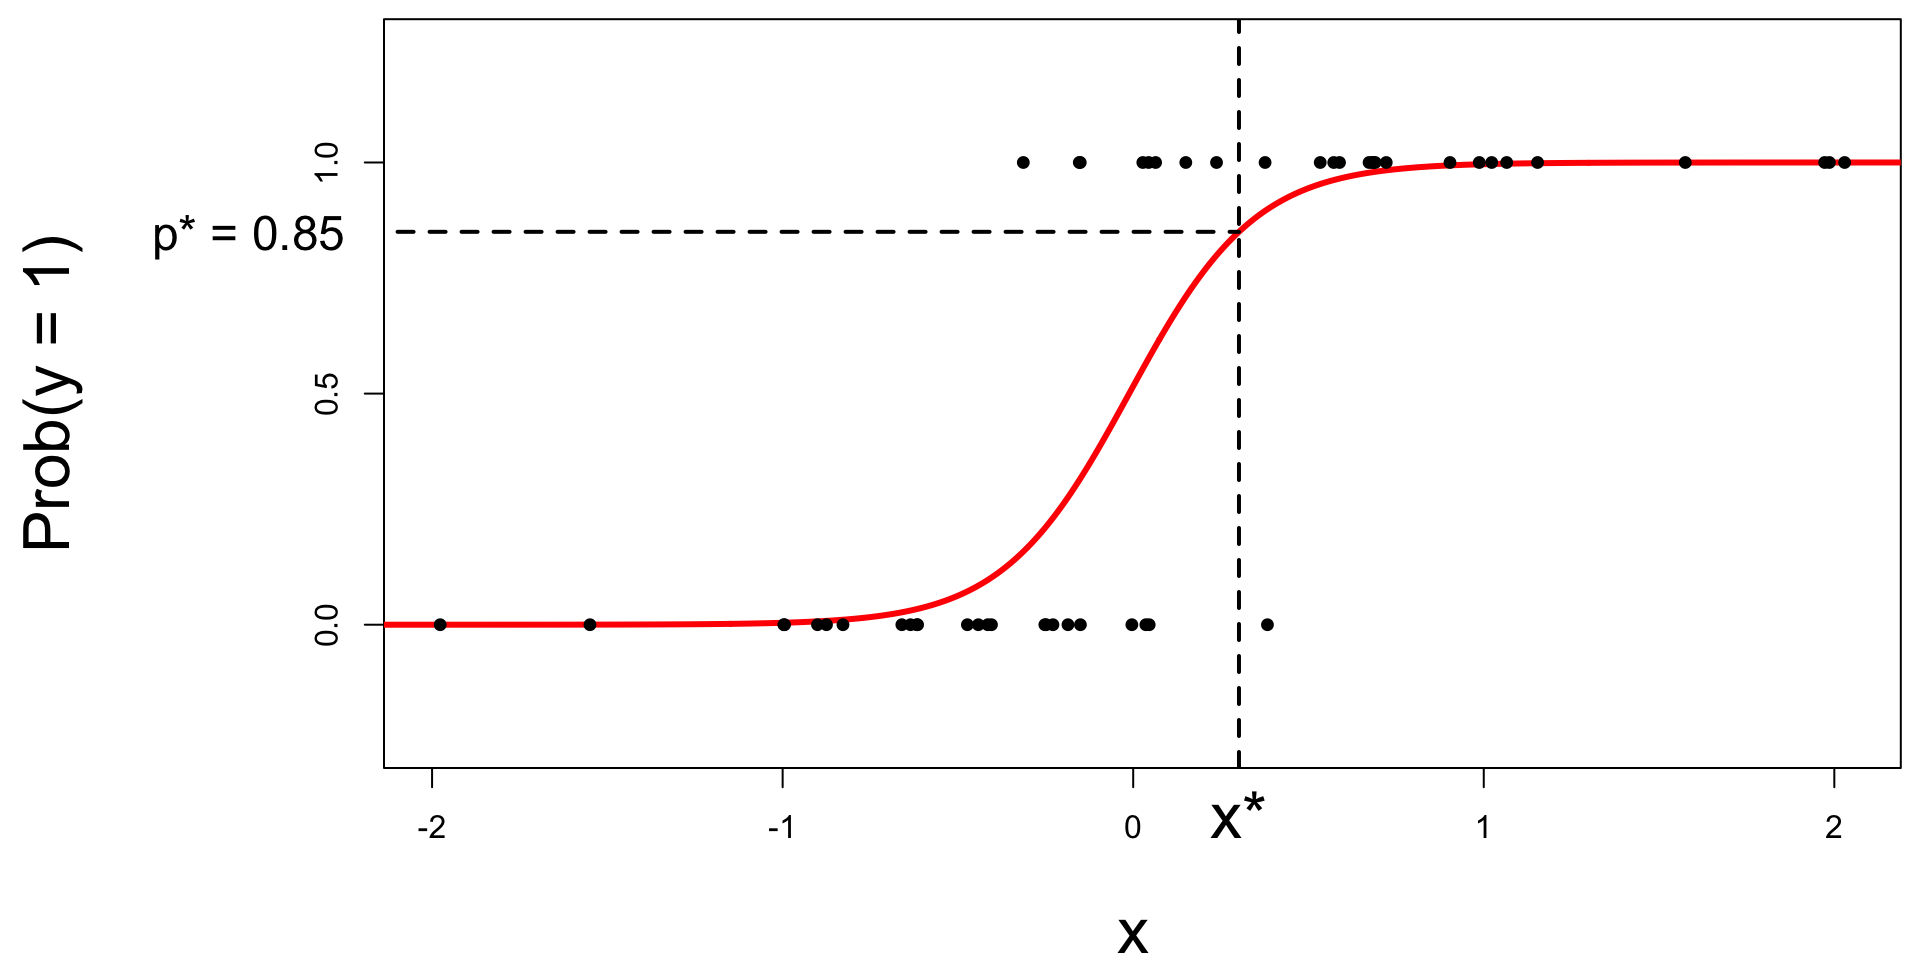
- if \(\text{Prob}(y=1)\leq p^*\), then predict \(\widehat{y}=0\);
- if \(\text{Prob}(y=1)> p^*\), then predict \(\widehat{y}=1\).
Step 3: classify a new arrival
A new person shows up with \(x_{\text{new}}\). Which side of the boundary are they on?
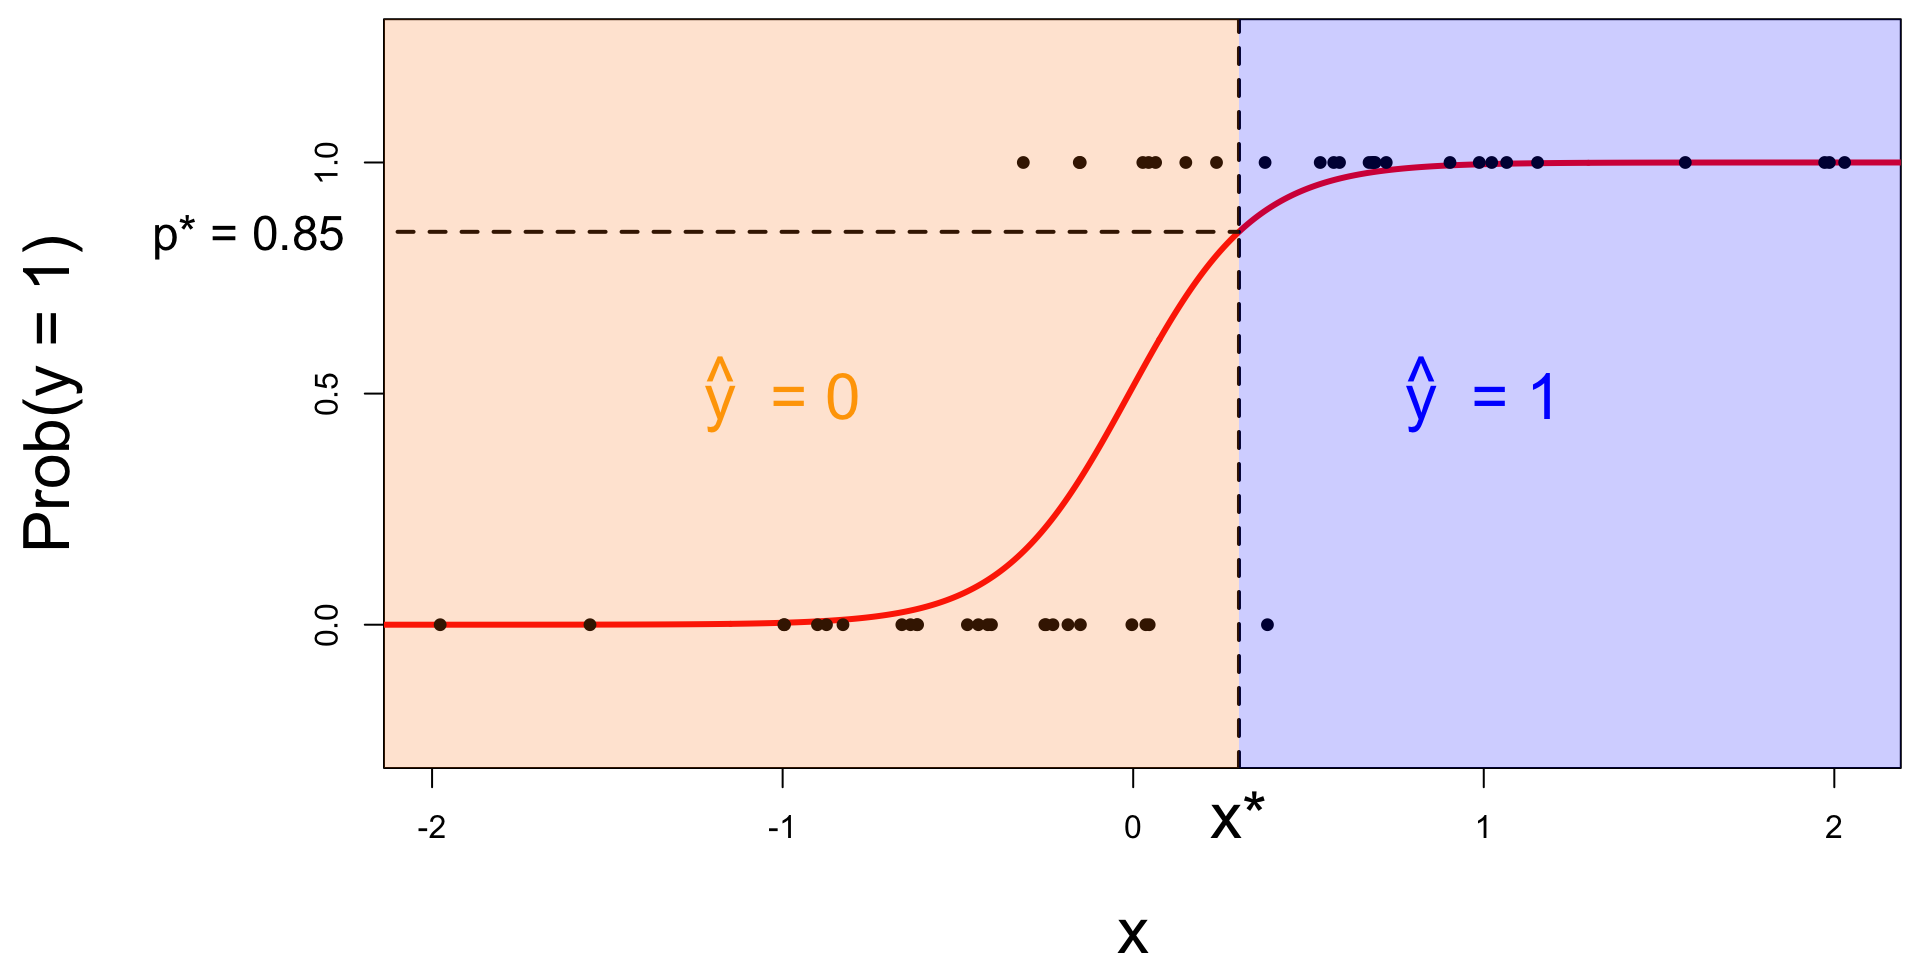
- if \(x_{\text{new}} \leq x^\star\), then \(\text{Prob}(y=1)\leq p^*\), so predict \(\widehat{y}=0\) for the new person;
- if \(x_{\text{new}} > x^\star\), then \(\text{Prob}(y=1)> p^*\), so predict \(\widehat{y}=1\) for the new person.
Let’s change the threshold
A new person shows up with \(x_{\text{new}}\). Which side of the boundary are they on?
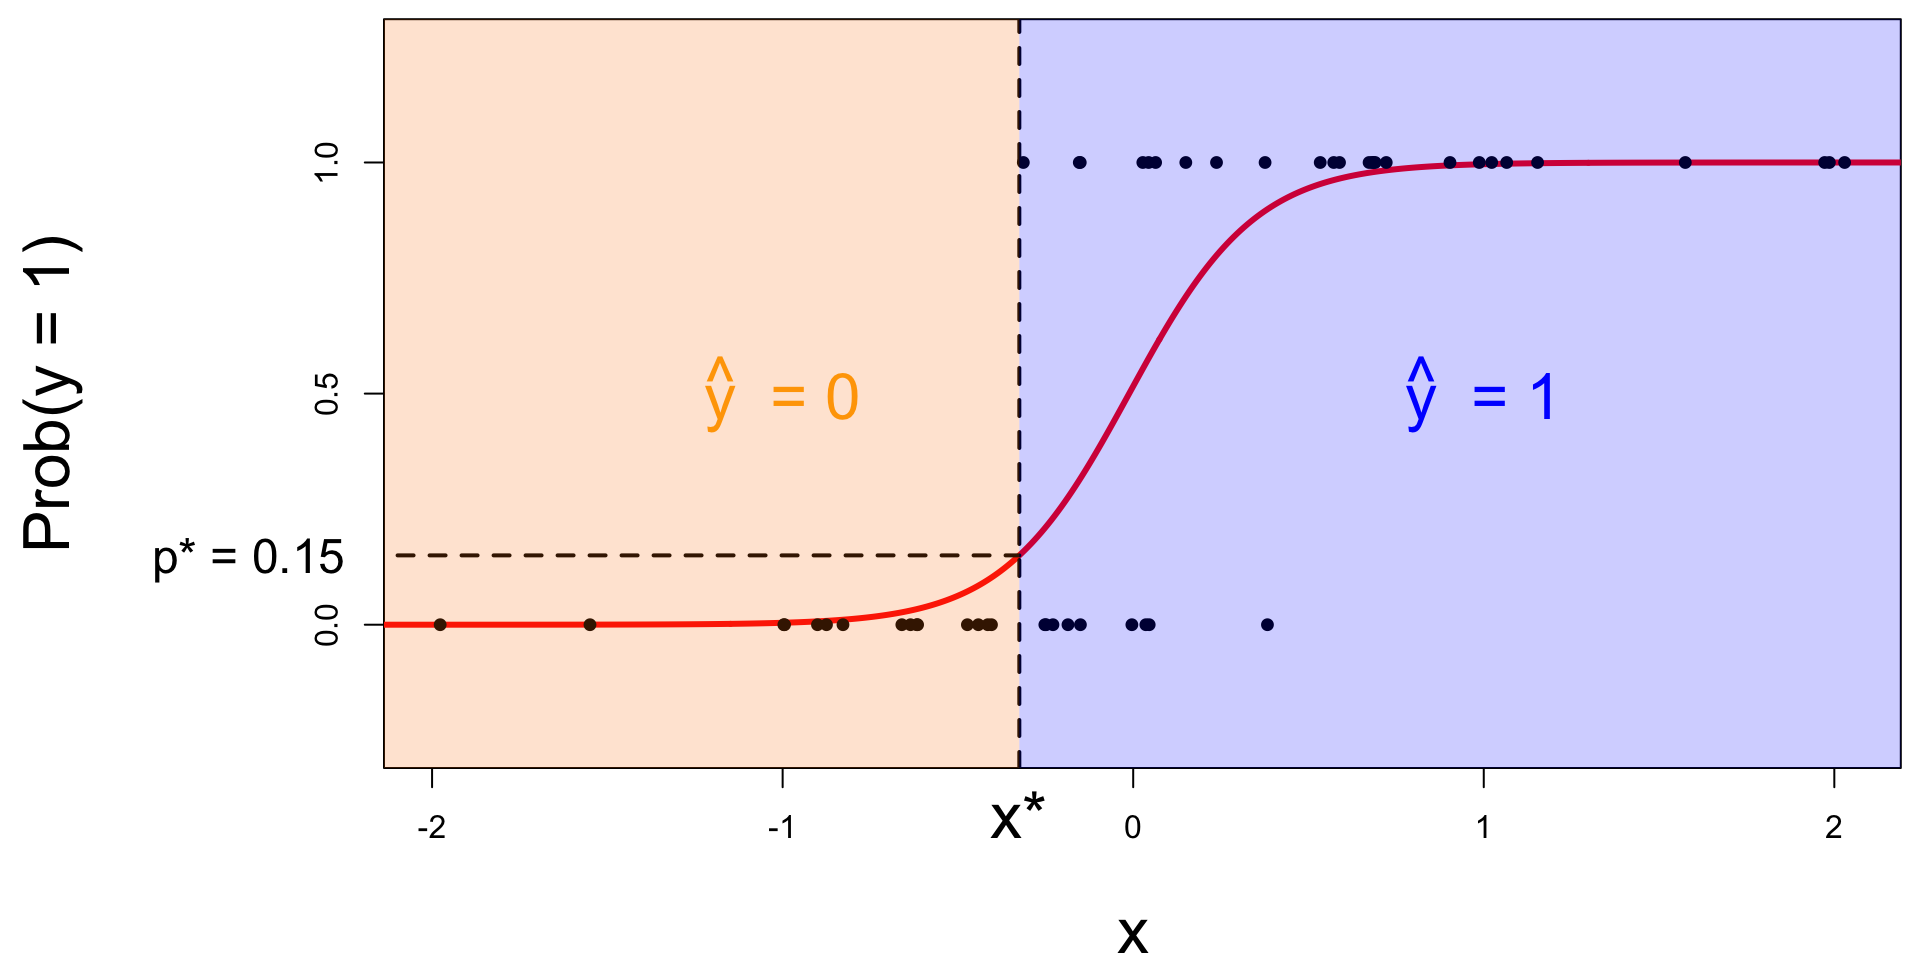
- if \(x_{\text{new}} \leq x^\star\), then \(\text{Prob}(y=1)\leq p^*\), so predict \(\widehat{y}=0\) for the new person;
- if \(x_{\text{new}} > x^\star\), then \(\text{Prob}(y=1)> p^*\), so predict \(\widehat{y}=1\) for the new person.
Nothing special about one predictor…
Two numerical predictors and one binary response:

“Multiple” logistic regression
On the probability scale:
\[ \text{Prob}(y = 1) = \frac{e^{\beta_0+\beta_1x_1+\beta_2x_2+...+\beta_mx_m}}{1+e^{\beta_0+\beta_1x_1+\beta_2x_2+...+\beta_mx_m}}. \]
For the log-odds, a multiple linear regression:
\[ \log\left(\frac{p}{1-p}\right) = \beta_0+\beta_1x_1+\beta_2x_2+...+\beta_mx_m. \]
Decision boundary, again
It’s linear! Consider two numerical predictors:

- if new \((x_1,\,x_2)\) below, \(\text{Prob}(y=1)\leq p^*\). Predict \(\widehat{y}=0\) for the new person;
- if new \((x_1,\,x_2)\) above, \(\text{Prob}(y=1)> p^*\). Predict \(\widehat{y}=1\) for the new person.
Model selection for logistic regression
Q: How do we decide if a logistic regression model is “good”?
A: Look at the error rates of its predictions. There are two kinds…

Too much vocabulary
| Truth | Prediction | Rate | Equivalently… | Want? |
|---|---|---|---|---|
| 0 | 0 | True negative | specificity | High |
| 0 | 1 | False positive | 1 - specificity | Low |
| 1 | 0 | False negative | 1 - sensitivity | Low |
| 1 | 1 | True positive | sensitivity | High |
Trading off between the errors
When you change the classification threshold, you change the error rates.
ROC curve
The receiver operating characteristic (ROC) curve allows to assess the model performance across a range of thresholds.
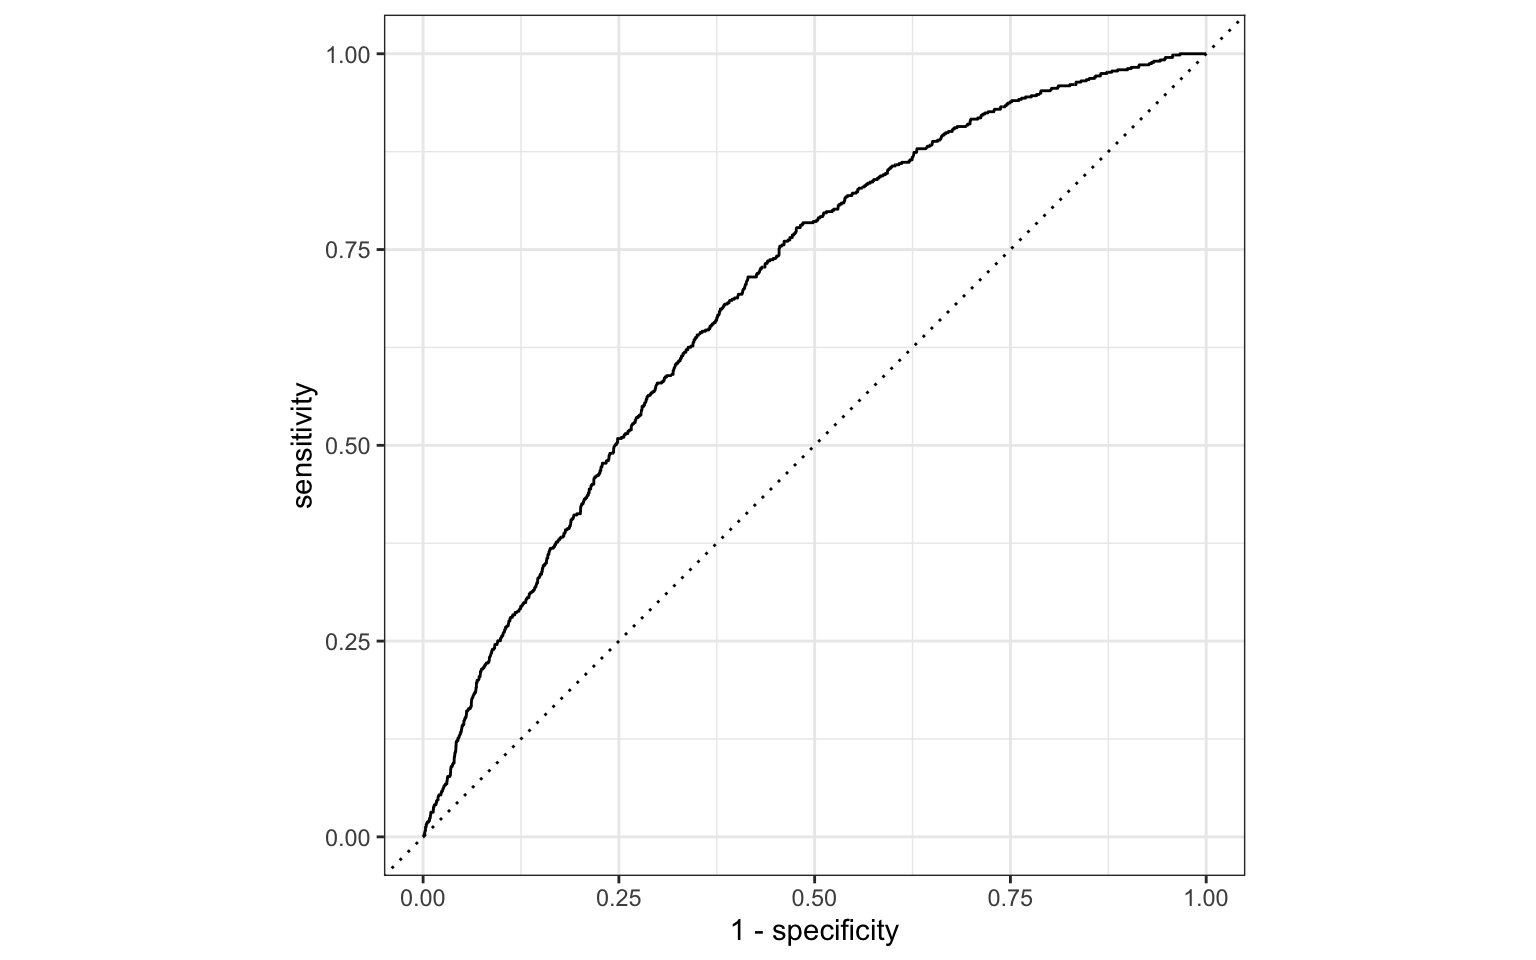
ROC curve
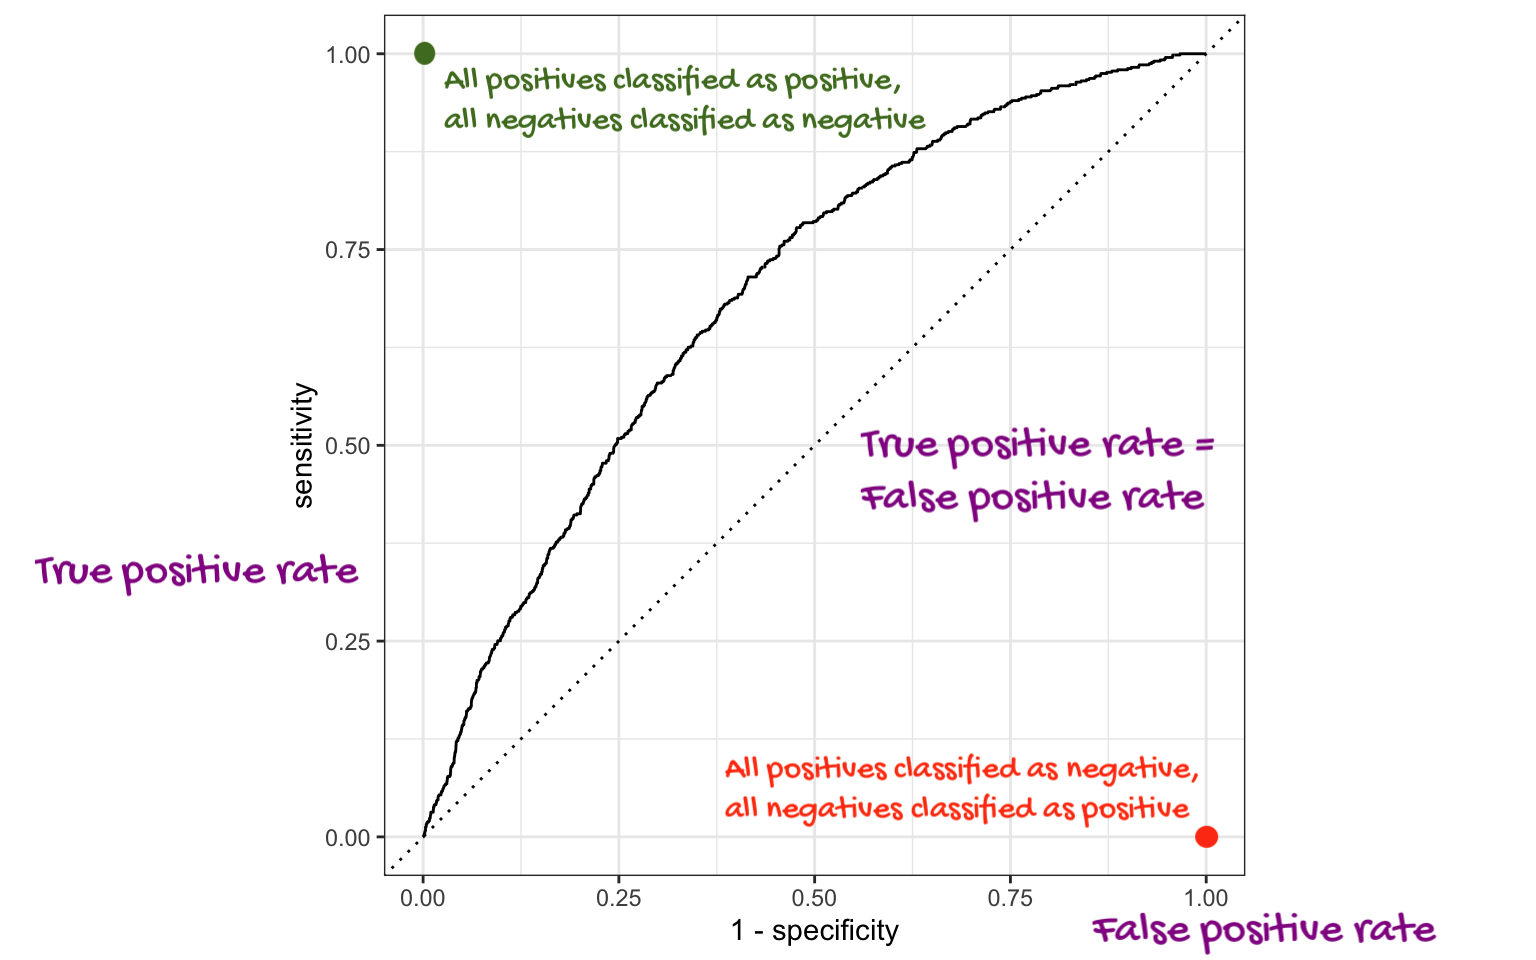
ROC curve

- The more “up and to the left,” the better;
- Up-and-to-the-left-ness can be quantified with the area under the ROC curve (a number between zero and one).